Cognos 8.4.1 GO! Dashboards and Cognos 10 Business Insight [Dashboards] provide user pleasing visual Business Intelligence with a user interface that almost any BI consumer can navigate or use to build or change to their requirements.
While this appeals enormously to our clients, a few have expressed concerns over the response time, particularly if distributed to a large audience and/or if accessed by the target audience at the same time (e.g. 500 users want their dashboard at 9:00 AM Pacific Time).
Cognos 10 Business Insight [Dashboards] are an evolution of Cognos 8.4.1 GO! Dashboards, which are based on Adobe Flash technology. This, in itself, has a higher footprint for the Cognos Server and User’s Browser vs. Cognos Portal Pages/portlets which use Report Views, etc. (which are not flash based). This is compounded by the fact that these Flash based dashboards are dynamic (refreshed/run at request time) vs. rendering saved outputs. In fact, you can’t save an entire Cognos Business Insight [Dashboard] as a saved output – only the individual widgets – manually.
In working with our Clients, we’ve found a number of ways of optimizing Cognos’ Flash based dashboards or using equivalent Cognos alternatives:
-
Cognos 8.4.1 GO! Dashboards and Cognos 10 Business Insight [Dashboards] – where users demand frequent changes for their dashboards.
- Encourage use of scheduled/saved outputs vs. on-demand running of reports
- Use GO!/Business Insight Dashboards as a primary interface for select users (e.g. Executives) and as a secondary (drill to, web page link) presentation for other users.
-
Use Cognos Portal Pages/pagelets or other dashboard techniques (e.g. QueryVision’s Web Parts) to provide equivalent presentation via:
- Report Views, folder “widgets” and other portal page components
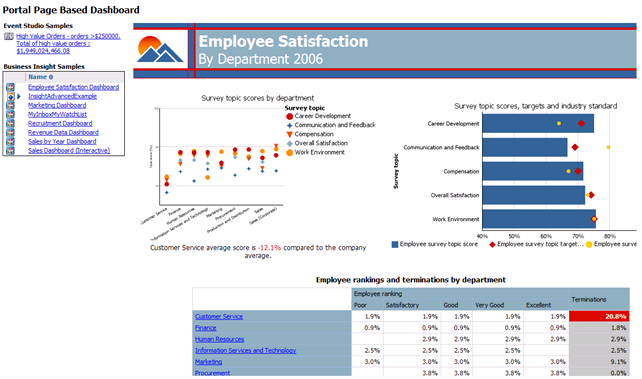
- Using Report Studio’s ability to provide “Dashboard” composition of multiple queries/presentations of grids, tables and charts in a single report – which can be fully equivalent to the Flash based presentations – where the layout/presentation doesn’t change frequently.
This merely brushes briefly on the possibilities for optimization of ease of use vs. performance. Contact QueryVision for more details and/or to investigate additional optimization techniques.
Below are some examples:
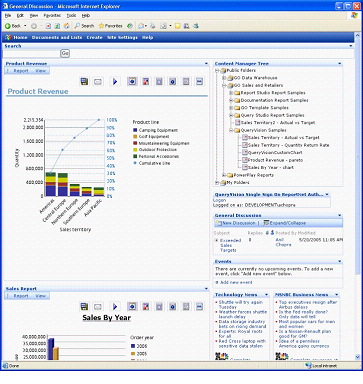
- A QueryVision Sharepoint based Dashboard
- A combination of Cognos Report Studio and other pagelet/Portal Page components. Note that this includes a Report Studio report showing multiple query/report elements and a folder showing interactive Business Insight Dashboards. This can also be exposed in SharePoint with QueryVision’s Report Viewer or Cognos Component Web Parts.